 Hi! My name is
Hadi Gunawan
Data Anaytics/Science Enthusiast, Graduate Student Majoring in Informatics Engineering (Computer Science & Engineering)
more about me portfolio download Resume
About me

Hadi Gunawan is an experienced Business Intelligence and Data Analyst with a background in Informatics Engineering. Over the past few years, he has been involved in BI development and reporting, showcasing strong proficiency in SQL, Tableau, Excel, Google Sheets, Power BI, and Python. Hadi is known for his analytical mindset and ability to collaborate effectively with cross-functional teams to support data-driven decision-making. He is currently open to analytical roles where he can apply his problem-solving skills and business insight to drive impact.
I welcome you to explore my personal website, where I have showcased a collection of my learning progress AKA "project". Your visit to the site would be greatly appreciated. Thank you for your interest!
Hard Skills
Soft Skills
Business Intelligence GOERS
- Helping GOERS see what matters through data.
Business Intelligence Save the Children Indonesia
- Generated and improved biweekly, monthly, and quarterly reports to support strategic decision-making, ensuring data accuracy and consistency.
- Analyzed CRM Salesforce data by collaborating with cross-functional teams, providing insights and solutions using Excel for ad hoc analysis and performance evaluation.
- Led CRM Salesforce development by identifying issues and feature needs, focusing on automation to reduce data errors and improve efficiency. Designed solutions, conducted testing, and ensured smooth deployment, successfully implementing 15 system improvements within 6 months.
Business Intelligence Developer at Unilever
- Developed Power BI dashboards for Digital Commerce Analytics, delivering insights on product data in Southeast Asia marketplaces.
- Collaborated with stakeholders to ensure data integrity through ETL processes and aligned data with business needs, improving data quality and supporting objectives.
- Ensured dashboard functionality and accuracy by providing clear explanations on calculations and formulas to stakeholders, ensuring alignment with business needs and user requirements.
Business Intelligence Developer at PT. Bank Negara Indonesia (Persero) Tbk
- Developed and enhanced 10+ Tableau dashboards for various divisions, including Board of Directors (BOD), turning ideas and data requirements into performance reports and business intelligence solutions. Gained insights into user needs, ensuring effective visualizations that are easy to understand, deliver actionable insights.
- Created user guides and documentation to clarify dashboard functions and data sources, ensuring clarity for future enhancements and ease of use. Addressed user queries effectively, improving adoption and engagement with BI solutions.
- Collaborated with Business Analysts, Data Engineers, and end-users to assess data needs, gather feedback, and drive improvements. Leveraged communication and project management skills to ensure timely and efficient project delivery.
Data Reporting Analyst Intern at SAC Indonesia
- Conducted comprehensive data processing, including data validation, cleaning, and consolidation from multiple sources to ensure accuracy and reliability for analysis.
- Contributed to the successful completion of 20+ client reports, providing valuable insights into key metrics and trends, empowering clients to make informed business decisions.
- Supported social media sentiment and competitor analysis projects, delivering actionable data to enhance clients' market positioning and inform strategic planning.
Retention and Winback (RWB) at MyRepublic Indonesia
- Proactively initiated outbound calls to customers identified as having a propensity to churn or switch to competitors, employing a customer-centric approach to minimize churn. Conducted surveys, upsold products, and provided personalized assistance, ensuring optimal customer retention.
- Collaborated in resolving customer issues and escalating critical reports to relevant departments, streamlining problem-solving processes and enhancing customer satisfaction. Proficiently utilized Google Sheets, CRM, Zendesk, internal CRM, and Hermes tools for efficient task management and communication.
- Consistently achieved exceptional performance, meeting and surpassing 100% of Key Performance Indicators (KPIs) each month. Demonstrated a dedication to excellence and a results-driven approach in achieving organizational goals.
Data Entry Intern at BP2T South Tangerang
- Entered data into Microsoft Excel, organized physical data within the warehouse, and maintained it.
- Engaging in effective communication with colleagues and internal employees to achieve the expected KPIs.
Bachelor of Informatics Engineering (Computer Science & Engineering) - Universitas Pamulang
I studied Informatics Engineering at Universitas Pamulang, learning core subjects like programming, databases, and statistics. This gave me a strong base to grow in data analytics and BI roles.
Recent works
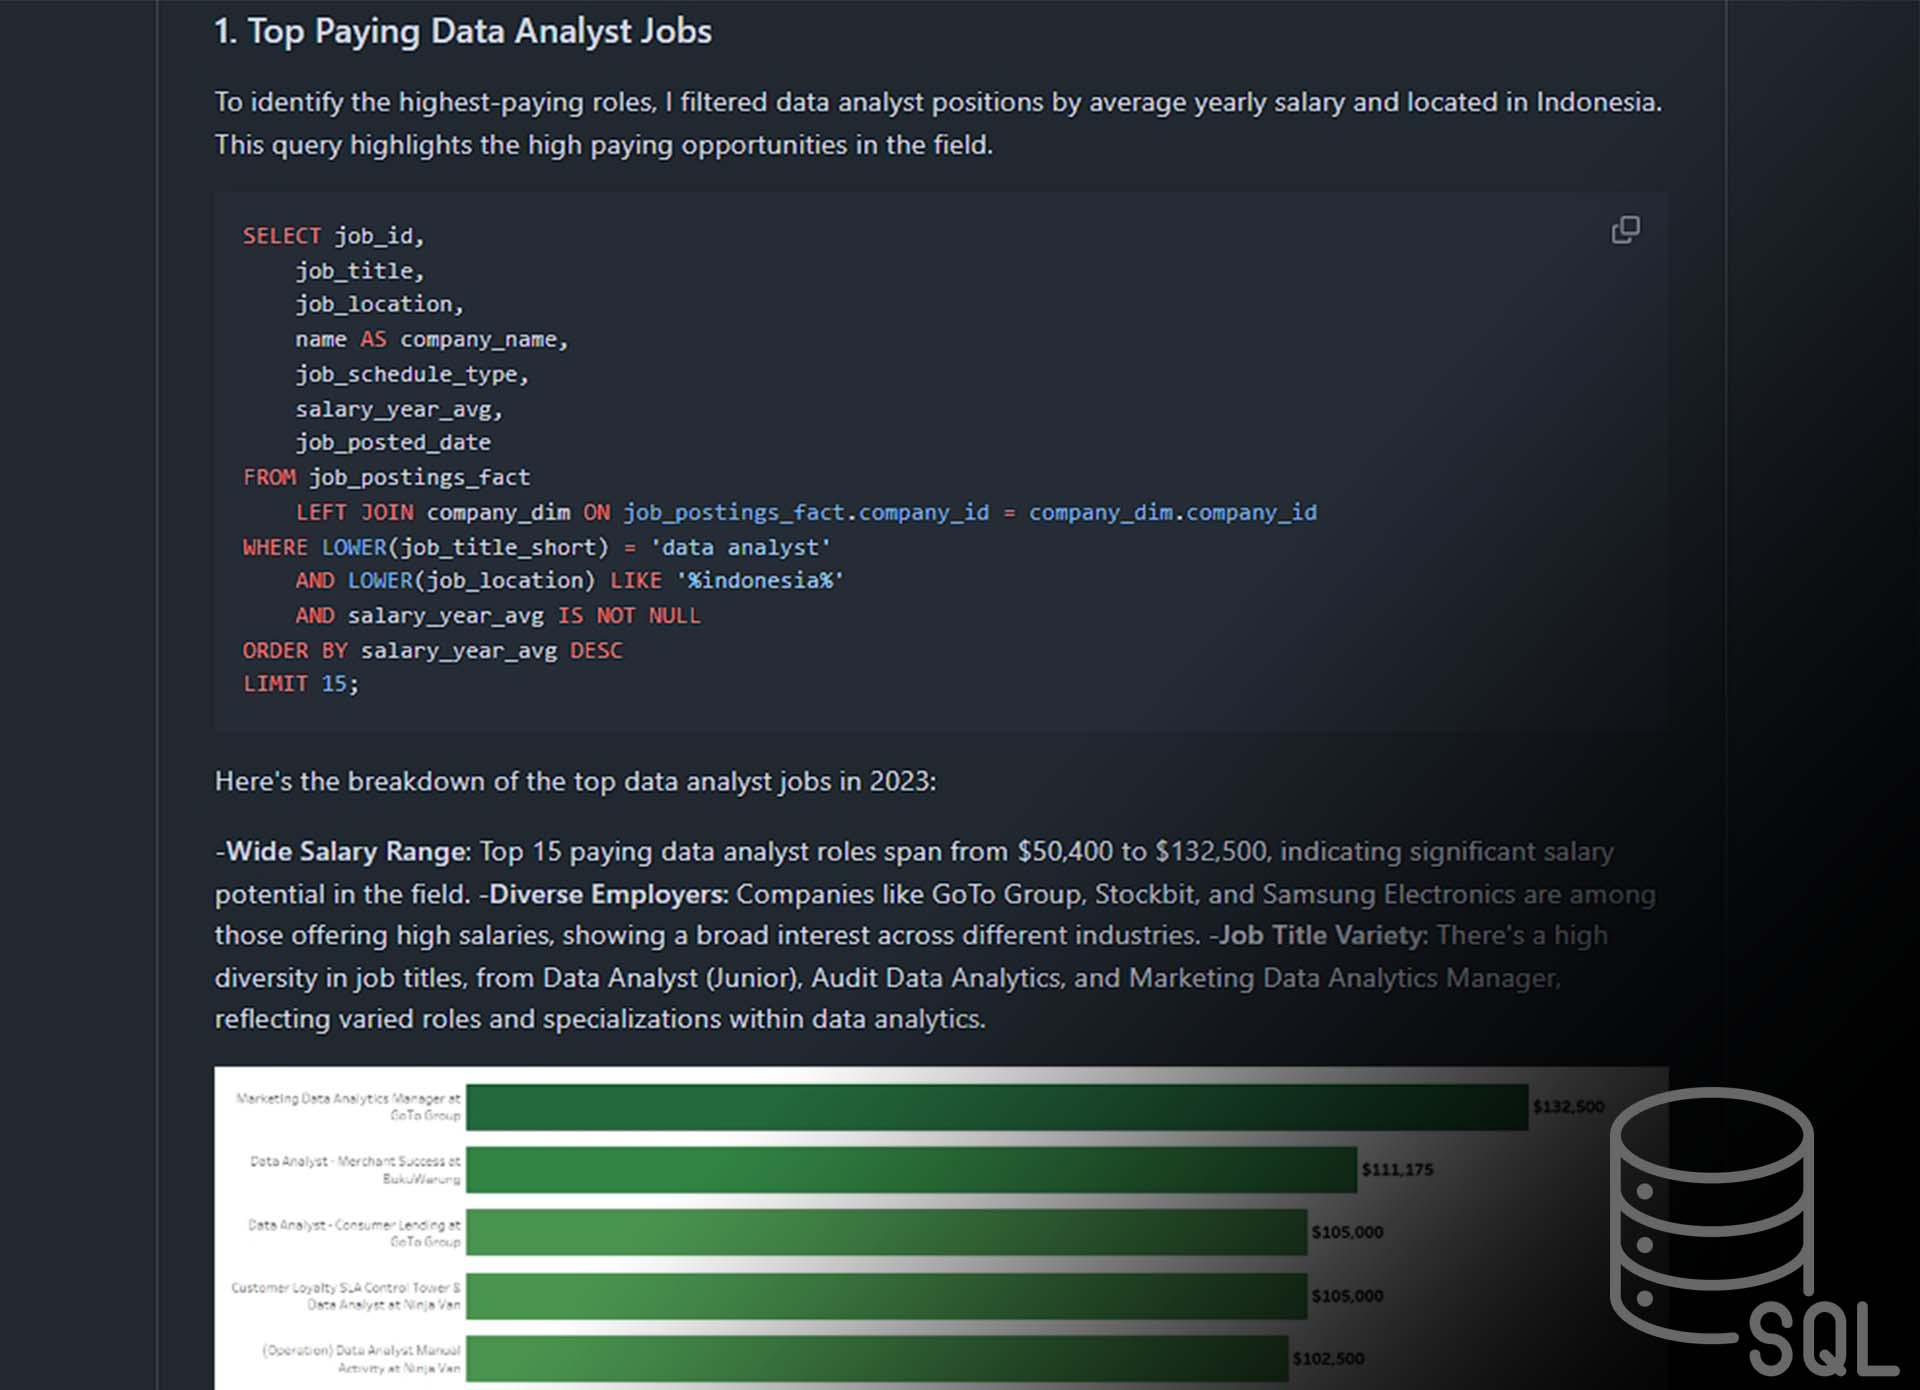
Data Job Analysis (Data Analysis in SQL)
I developed this project to explore and better understand the data analyst job market, with a focus on uncovering the most in-demand and highest-paying skills. Using SQL as the main tool, I queried a dataset of global job postings to answer key questions such as:
- What are the top-paying data analyst jobs in Indonesia?
- Which skills are required for these roles?
- What skills are most in demand—both in Indonesia and worldwide?
- Which skills tend to correlate with higher salaries?
- Etc.
- Created - April 2025
- Technologies/Skills used - SQL, PostgreSQL, VS Code, Data Analysis, Data Visualization, Git, Github.
- Role - Data Analyst, Business Intelligence, Business Analyst, Etc.
- View Online - Click here

Project Microsoft Excel (Data Analysis in Ms. Excel)
This is a learning project that I made while learning and doing a "refresher" using microsoft excel.
In the realm of business, Microsoft Excel serves as an invaluable tool for data analysis, enabling organizations to address critical inquiries. The data analytics process involves five fundamental steps that we are gonna use in this project, which involves:
- Defining the Question: This initial phase entails framing precise questions, such as "What are our best-selling products?" or "What is our total revenue?" or "How is revenue distributed among various payment methods?" These inquiries set the stage for the analysis journey.
- Collecting the Data: Once the questions are defined, the next step involves gathering the relevant data. This data could originate from various sources, including sales records, transaction histories, and payment records. Ensuring data accuracy and completeness is vital at this stage.
- Cleaning the Data: Data often arrives in raw, unstructured formats. The cleaning process involves removing inconsistencies, duplicates, and errors, transforming the data into a more manageable and accurate form. Clean data is essential for trustworthy results.
- Analyzing the Data: With clean and organized data at hand, Excel's powerful analytical tools come into play. Techniques like pivot tables, charts, and formulas can be employed to answer the questions posed earlier. This step unveils insights into best-selling products, total revenue, and revenue distribution by payment method.
- Sharing or Presenting the Findings: The final step involves conveying the results of the analysis to stakeholders, be it through reports, presentations, or visualizations created, in this case is in Excel. Effectively sharing the findings ensures that actionable decisions can be made based on the data-driven insights.
- Created - September 2023
- Technologies/Skills used - Microsoft Excel, Pivot Table, Data Analysis, Data Visualization.
- Role - Data Analyst, Business Intelligence, Business Analyst, Etc.
- View Online - Click here

Project Python (Exploratory Data Analysis in Pandas)
This is a small learning project that I'm doing when I following the free "Data Analyst Bootcamp" playlist created by Alex The Analyst.
We are taught to do a Exploratory Data Analysis (EDA) process step by step by our amazing youtuber Alex, we are doing it using jupyter notebook (python), Exploratory data analysis (EDA) is used to analyze and investigate data sets and summarize their main characteristics, often employing data visualization methods. It helps determine how best to manipulate data sources to get the answers we need, making it easier for us to discover patterns, spot anomalies, test a hypothesis, or check assumptions. Please feel free to kindly check my work by clicking the link in the bottom of this page if you want to know how I'm doing it.
Even though it's free tutorial on youtube yet I have learned so many new things as an Data Science point of view, especially when using Python and their libraries and also a really nice 'resfresher' about python
Photo by Campaign Creators on Unsplash
- Created - August 2023
- Technologies/Skills used - Jupyter Notebook, Python, Pandas, Data Analysis, Data Visualization.
- Role - Data Analyst, Business Intelligence, Business Analyst
- View Online - Click here
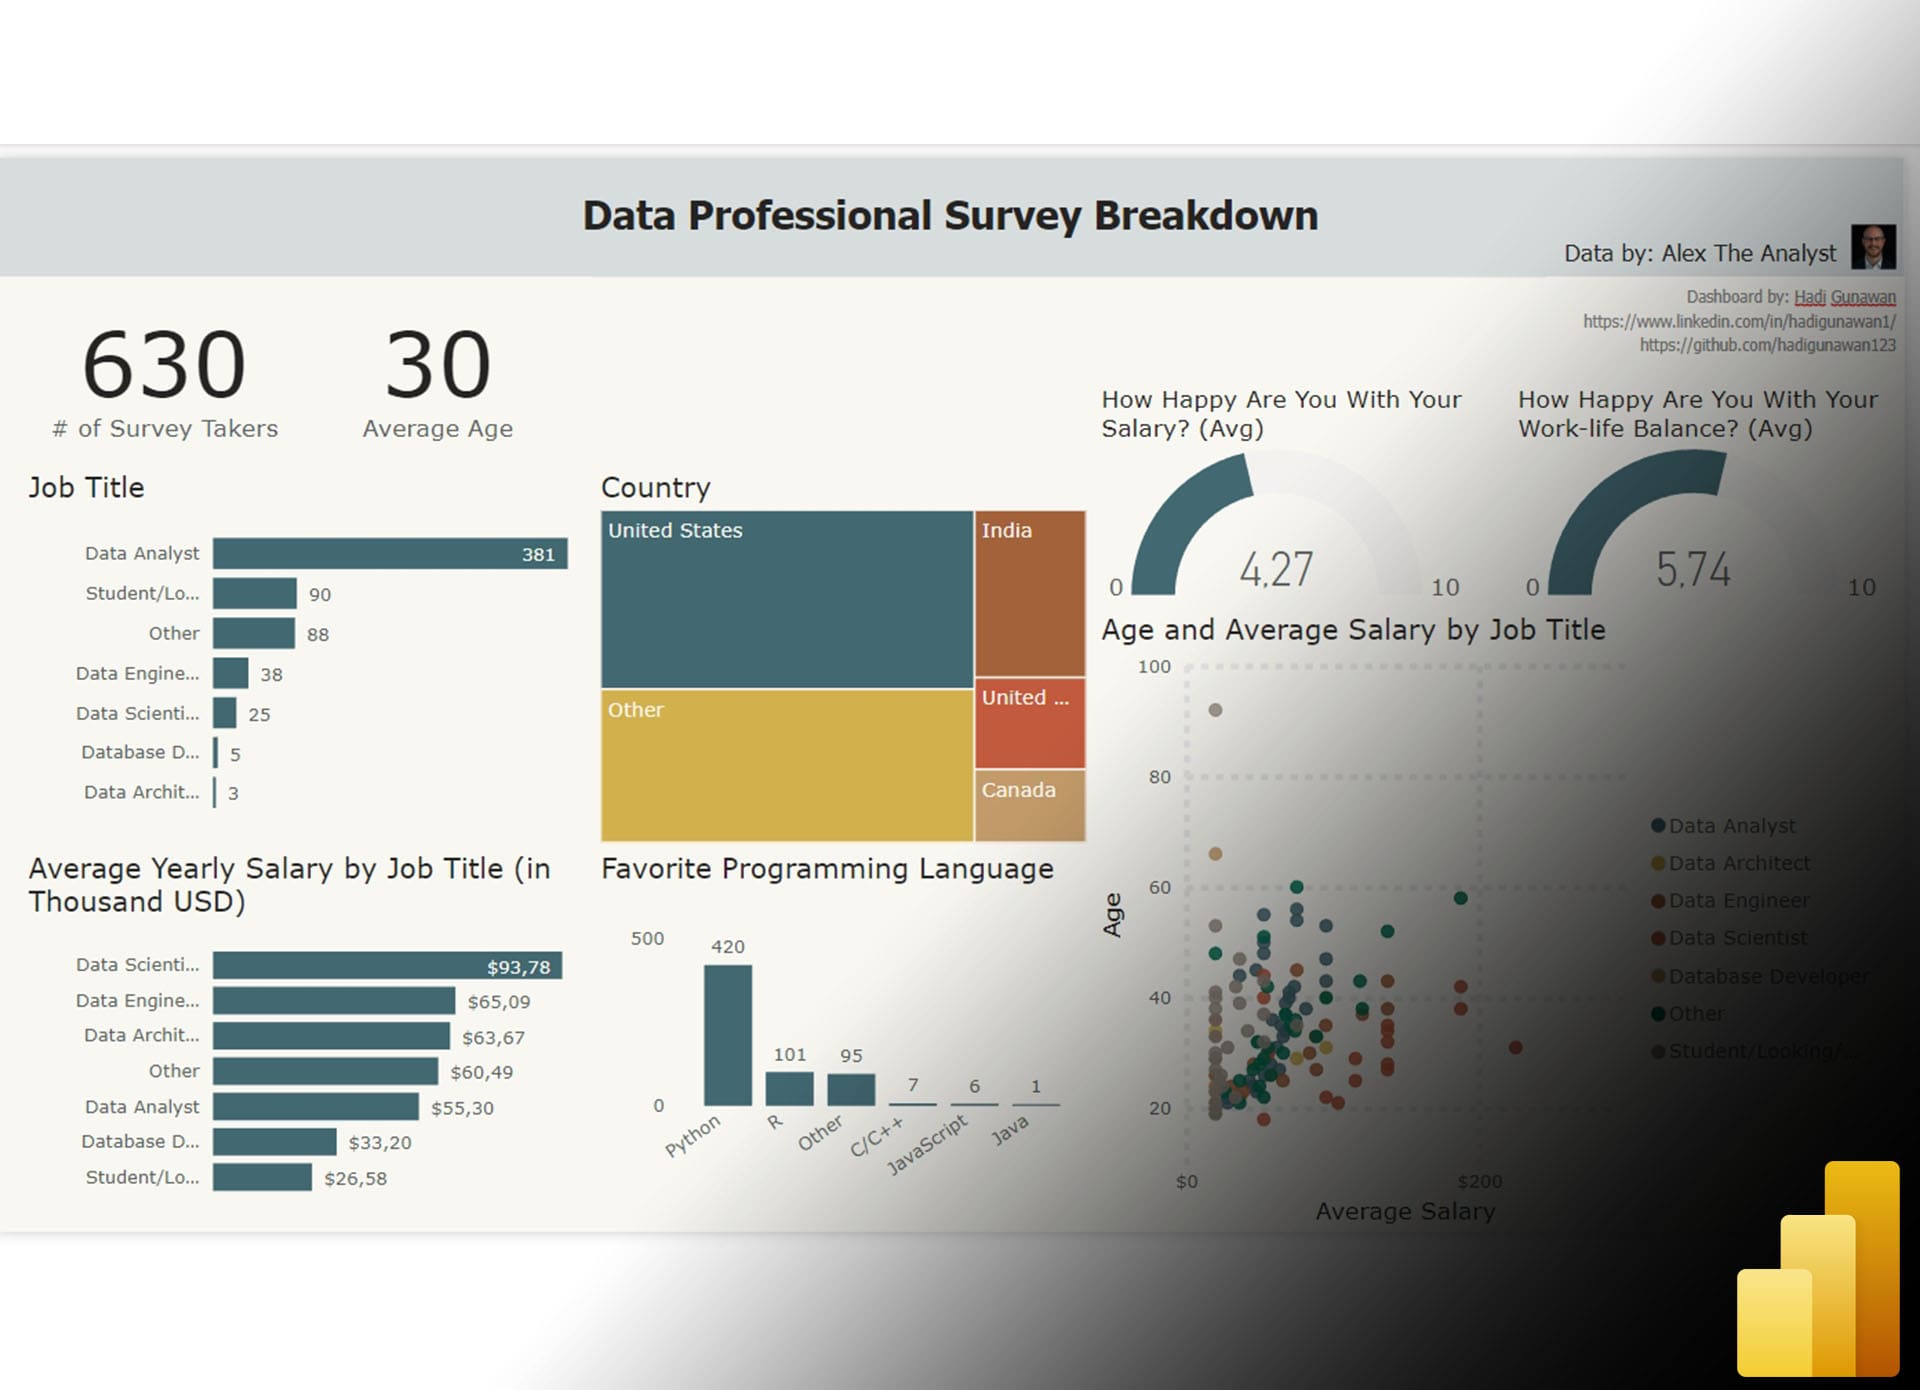
Project Power BI (Dashboard Job Survey)
This is a dashboard view that I created using a dataset about Job Survey by Alex The Analyst. On this dashboard, we can see some metrics that I visualized using Power BI, for instance: the number of survey takers, correlations between some data, average salary, etc.
- Created - August 2023
- Technologies/Skills used - Power BI, Data Visualization, Power Query, Data Cleaning
- Role - Data Analyst, Business Intelligence, Business Analyst
- View Online - Click here

Project Python (Data Cleaning in Pandas)
This is a small learning project that I'm doing when I following the free "Data Analyst Bootcamp" playlist created by Alex The Analyst.
We are taught to do a data cleaning process step by step by our amazing youtuber Alex, we are doing it using jupyter notebook (python), Data cleansing is important because it improves our data quality and in doing so, increases overall productivity. When we clean our data, all outdated or incorrect information is gone, leaving us with the highest quality information. Please feel free to kindly check my work by clicking the link in the bottom of this page if you want to know how I'm doing it.
Even though it's free tutorial on youtube yet I have learned so many new things as an Data Science point of view, especially when using Python and their libraries and also a really nice 'resfresher' about python
Photo by Mika Baumeister on Unsplash
- Created - August 2023
- Technologies/Skills used - Jupyter Notebook, Python, Pandas
- Role - Data Analyst, Business Intelligence, Business Analyst
- View Online - Click here
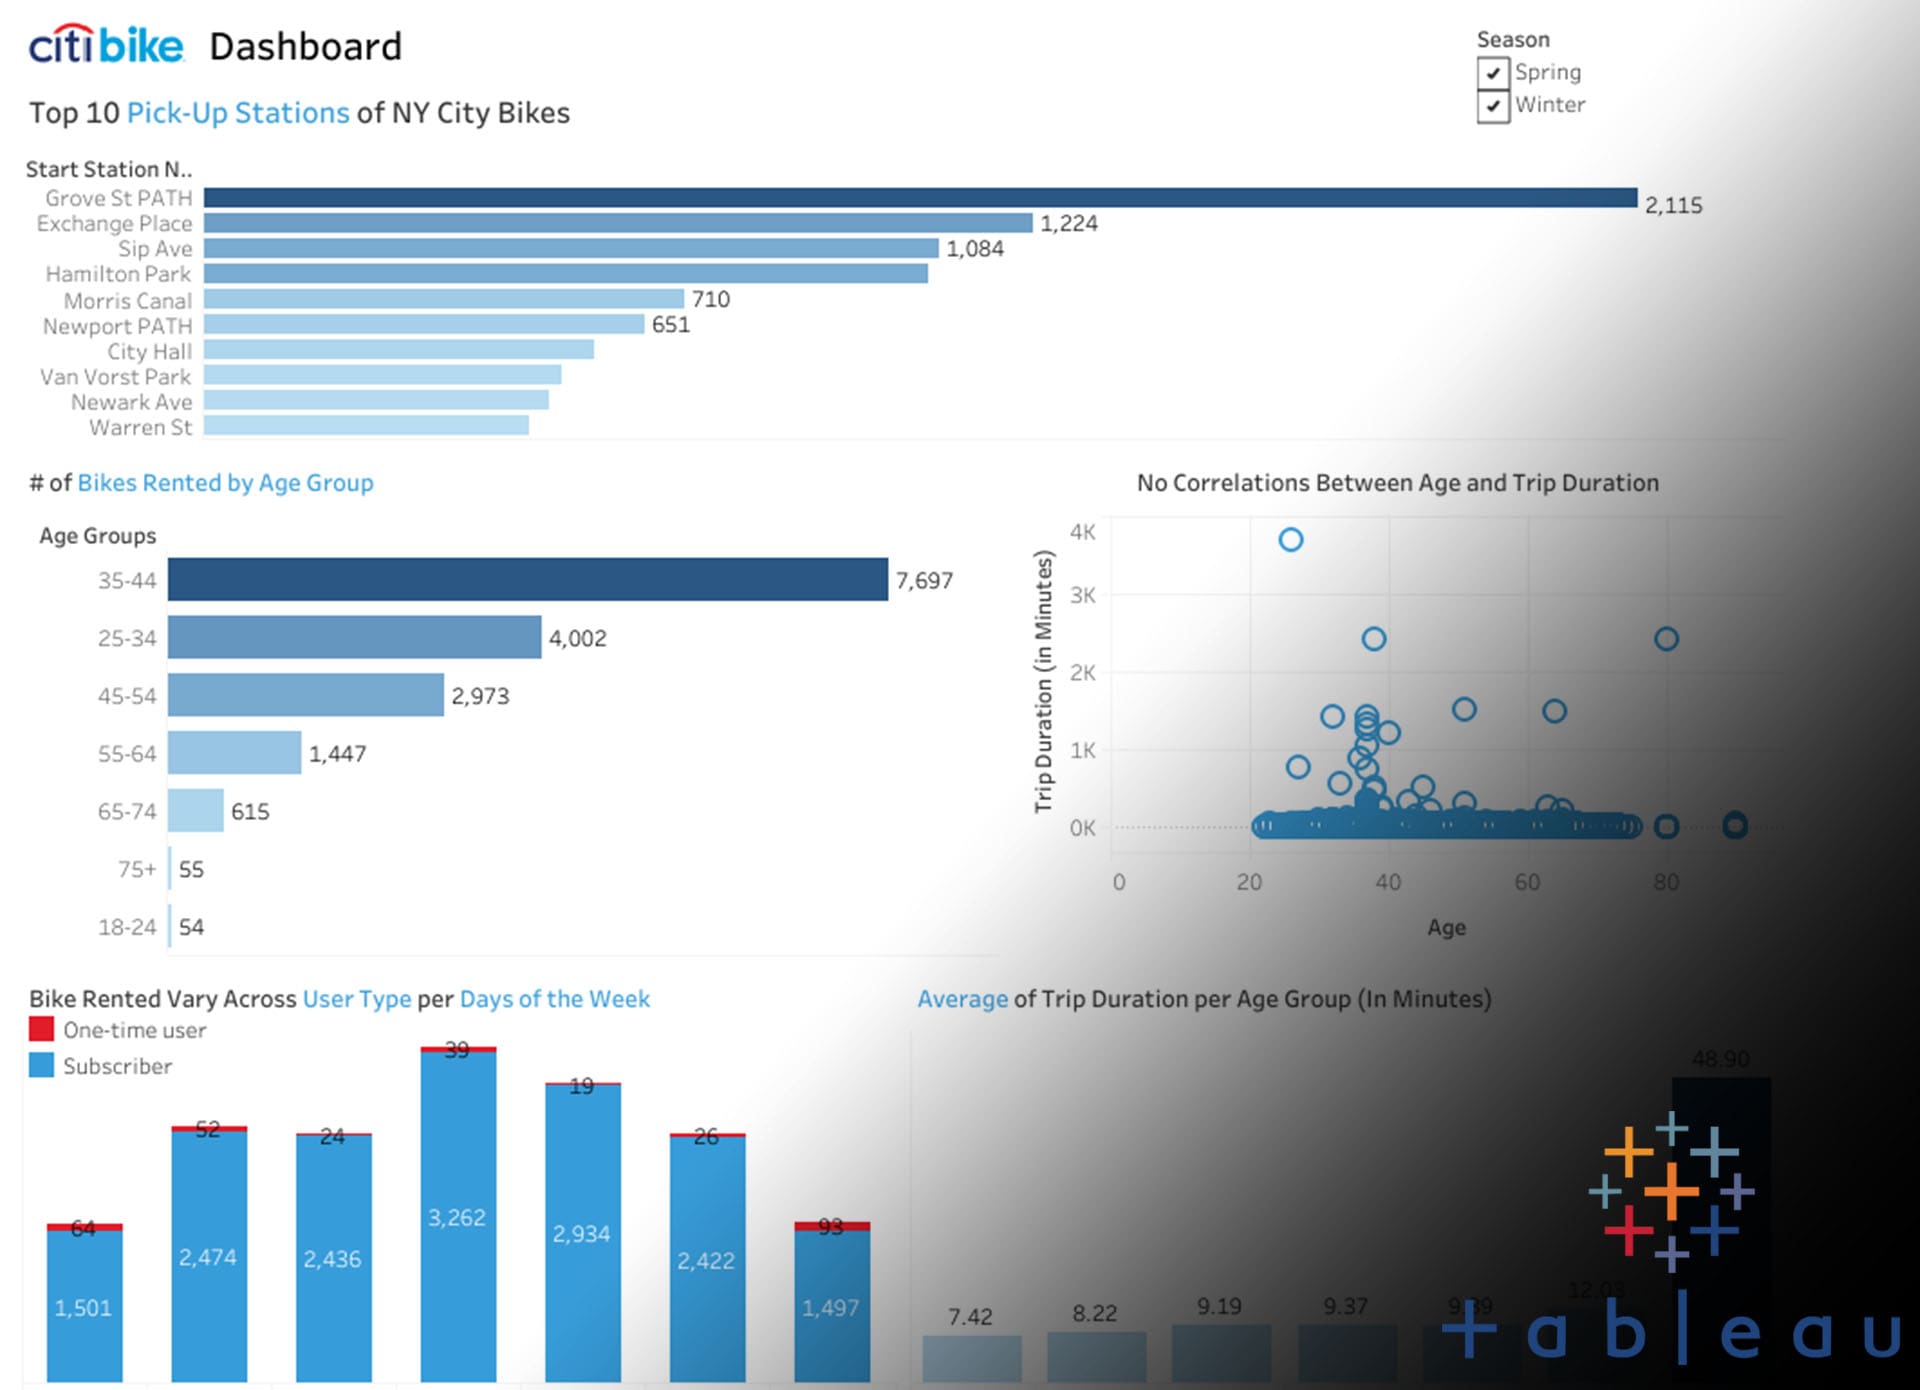
Project Tableau (Dashboard Citi Bike)
This is a dashboard view that I created using an open dataset about Citi Bike New York. On this dashboard, we can see some metrics that I visualized using tableau, for instance: the number of bikes rented, correlations between some data, and the most popular stations for Citi bike customers to start their journey using Citi bike services, etc.
On this dashboard we can find out the answer of some business question, I make 5 questions:
- What are the most popular pick-up locations across the city for NY Citi Bike rental?
- How does the average trip duration vary across different age groups?
- Which age group rents the most bikes?
- How does bike rental vary across the two user groups (one-time users vs long-term subscribers) on different days of the week?
- Does user age impact the average bike trip duration?
We got the answer for these question!, when we got an answer for the question then we can make anctionable points that can be applied to the business, here's some insights that we got: Top 10 of most popular pick-up stations are Grove St Path, Exchange Place, Sip Ave, Hamilton Park, Morris Canal, Newport Path, City Hall, Van Vorst Park, Newark Ave, Warren St. We can install more bikes at these locations so we don't running out of bikes when spikes.
we found out the winner of longest average of trip duration is our customer with age group of 75+ years old, Looks like our elderly customer likes to roam around town with our bikes a little bit longer, yes that's true, but actually, after we visualize the correlation about that (check viz of question number 5), we can clearly see that actually it just because the number of elderly who rent our bike is less than 60 in total, compared to the customer of 34-44 age group who has around 7600+ rents
For the question number 3 we can clearly see that Age group of 35-44 years old rents most of our bikes, so maybe we can do some "special treatment" for users of this age group, since they are our most valuable customers, while keep taking attention to the rest of the age group, so they keep using our services
next question is the vary of the two of user group (one-time and subscribers) and our loyal subscribers user still dominating in number of bikes rents it's good, we can retentioning them, maybe the next step is we can give first-time subscriptions promo to people who haven't become our subscribers yet, we can make event too to aware more people about our product, and the last question answer is does age and trip durations have a correlations?, the answer is No, this correlation result is an example of our customer behavior while using our products
- Created - September 2022
- Technologies/Skills used - Tableau, Google Sheets, Data Visualization
- Role - Data Analyst, Business Intelligence, Business Analyst
- View Online (Slides) - Click here
- View Online (Tableau Public) - Click here
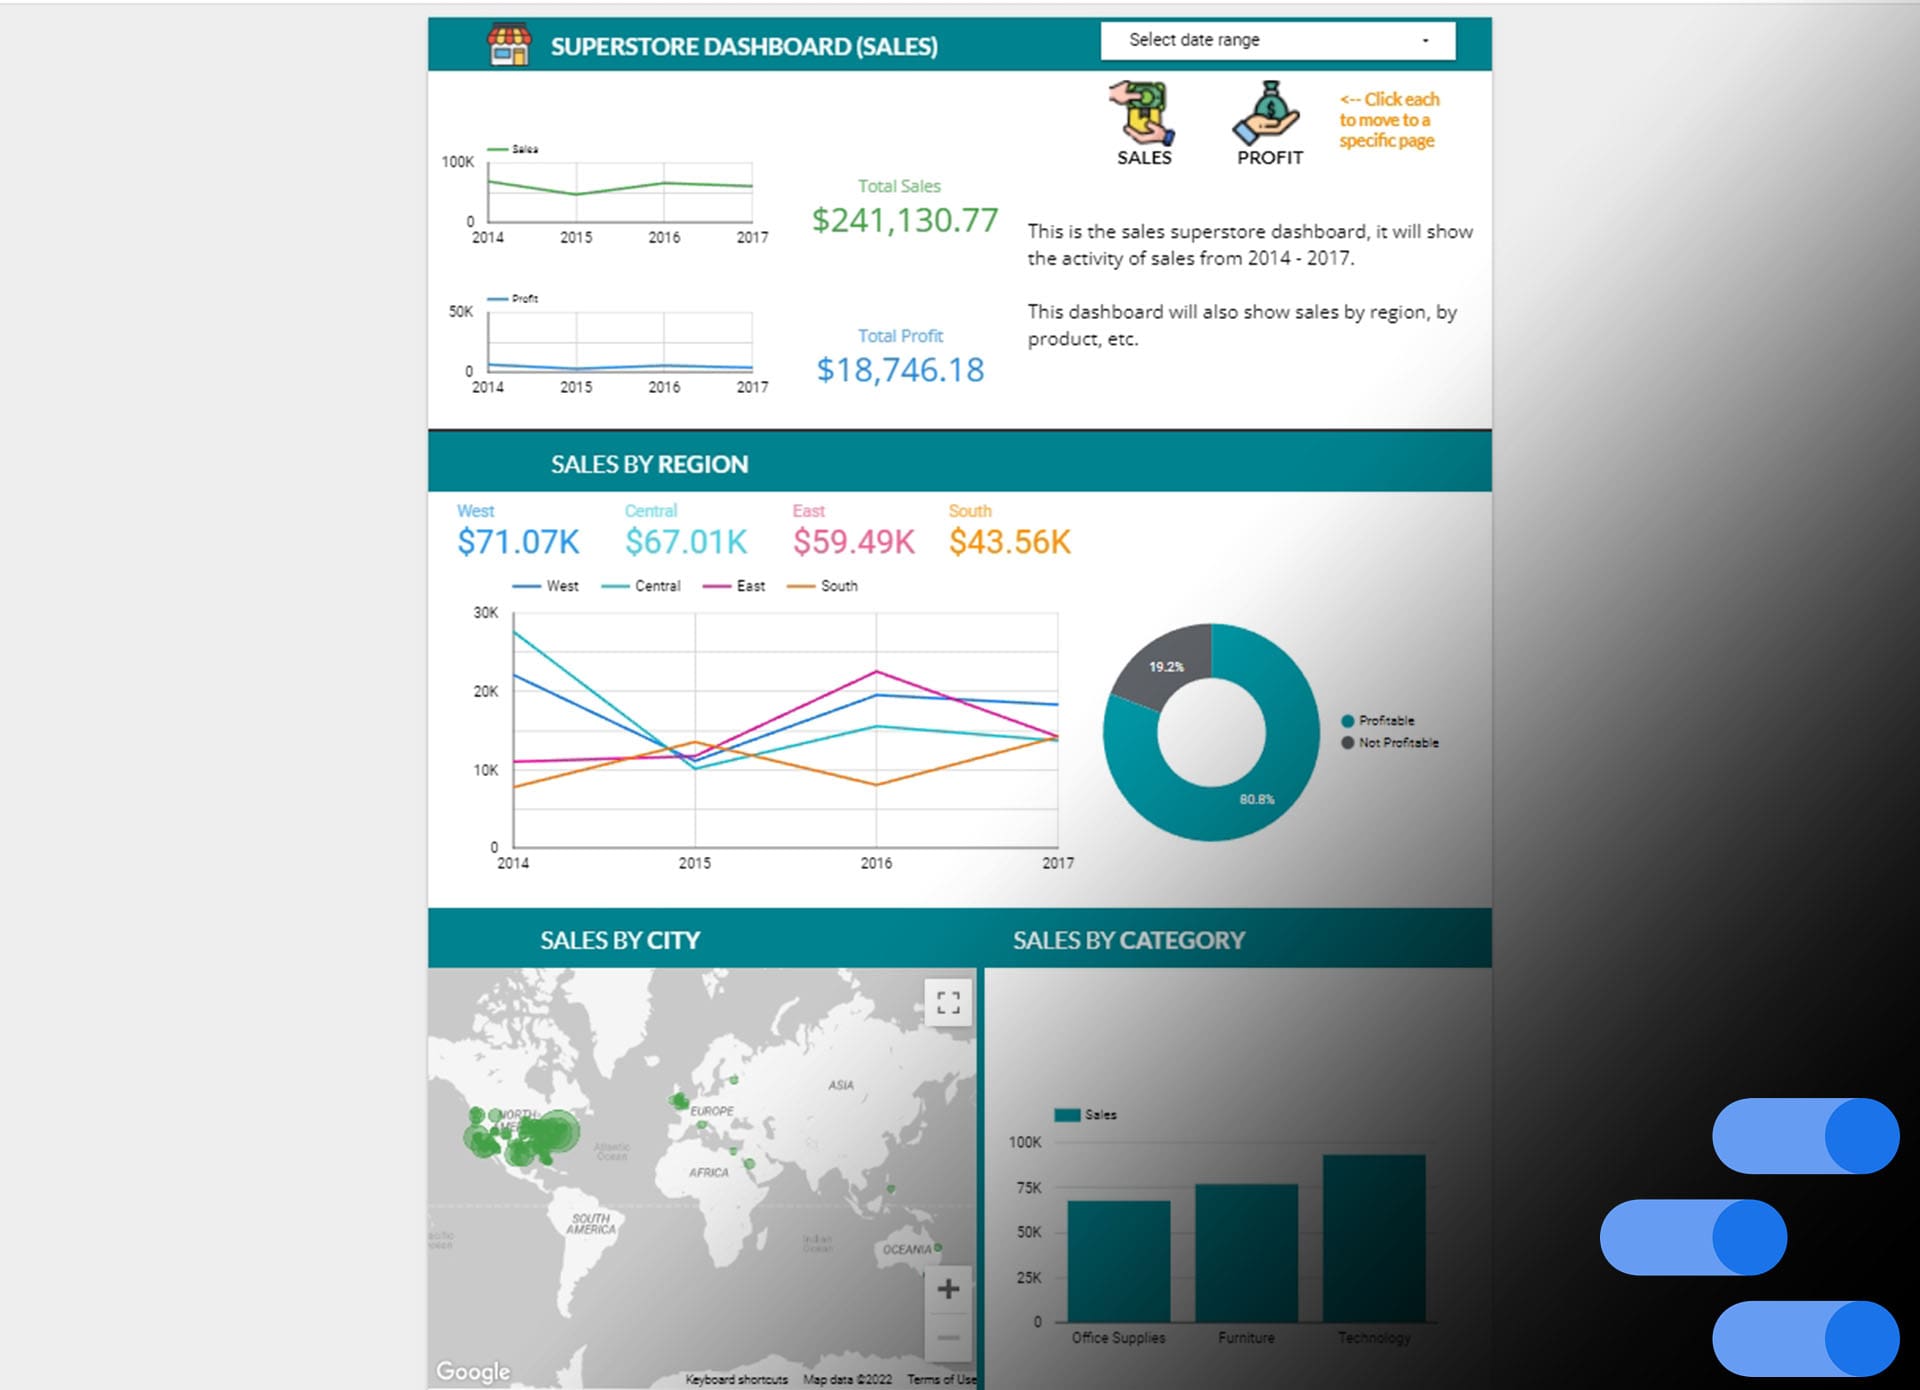
Project Google Data Studio (Dashboard Superstore Sales and Profit)
This is a dashboard view that I created using an open dataset about (Superstore). On this dashboard we can see the total sales and profit with bar chart, maps display, doughnut chart, line chart, etc.
On the superstore dashboard we can find out the total total Sales and Profit within a period of 4 years (2014-2017), Vizz data is quite attractive because there are many clickable menus because there are 2 different pages, there is also a date filter so we can find out more specifically the number of sales and profits at a certain time.
It turns out that the WEST state produces the most sales and profits, we also find that sales tend to stagnate from year to year, there are approximately 20% of goods that do not generate profits. And finally, after checking profit by category, it turns out that the FURNITURE category does not generate profits and tends to lose money!
- Created - April 2022
- Technologies/Skills used - Google Data Studio, Data visualization
- Role - Data Analyst, Business Intelligence, Business Analyst
- View Online - Click here

Project Python (Data Processing and Exploratory Data Analysis Using Python)
This is a small project that I'm doing when I following the event from Rakamin (Data Science Free Trial Course).
We are taught to do a Data Processing and Exploratory Data Analysis step by step by our instructors, we are doing it using google colab (python), we are taught to get to know our dataset before doing an analysis using some libraries like pandas (DataFrame) and seaborn/ matplotlib.pyplot please feel free to kindly check my work by clicking the link in the bottom of this page if you want to know how I'm doing it.
Even though it's free trial course I have learned so many new things as an Data Science point of view, especially when using Python. The Data Processing part is the most challenging part, because there are several challenges that need to be completed by the participants
- Created - April 2022
- Technologies/Skills used - Google Colab, Python, Pandas, Data Analysis, Data Processing
- Role - Data Analyst, Business Intelligence
- View Online (Data Processing) - Click here
- View Online (Exploratory Data Analysis) - Click here
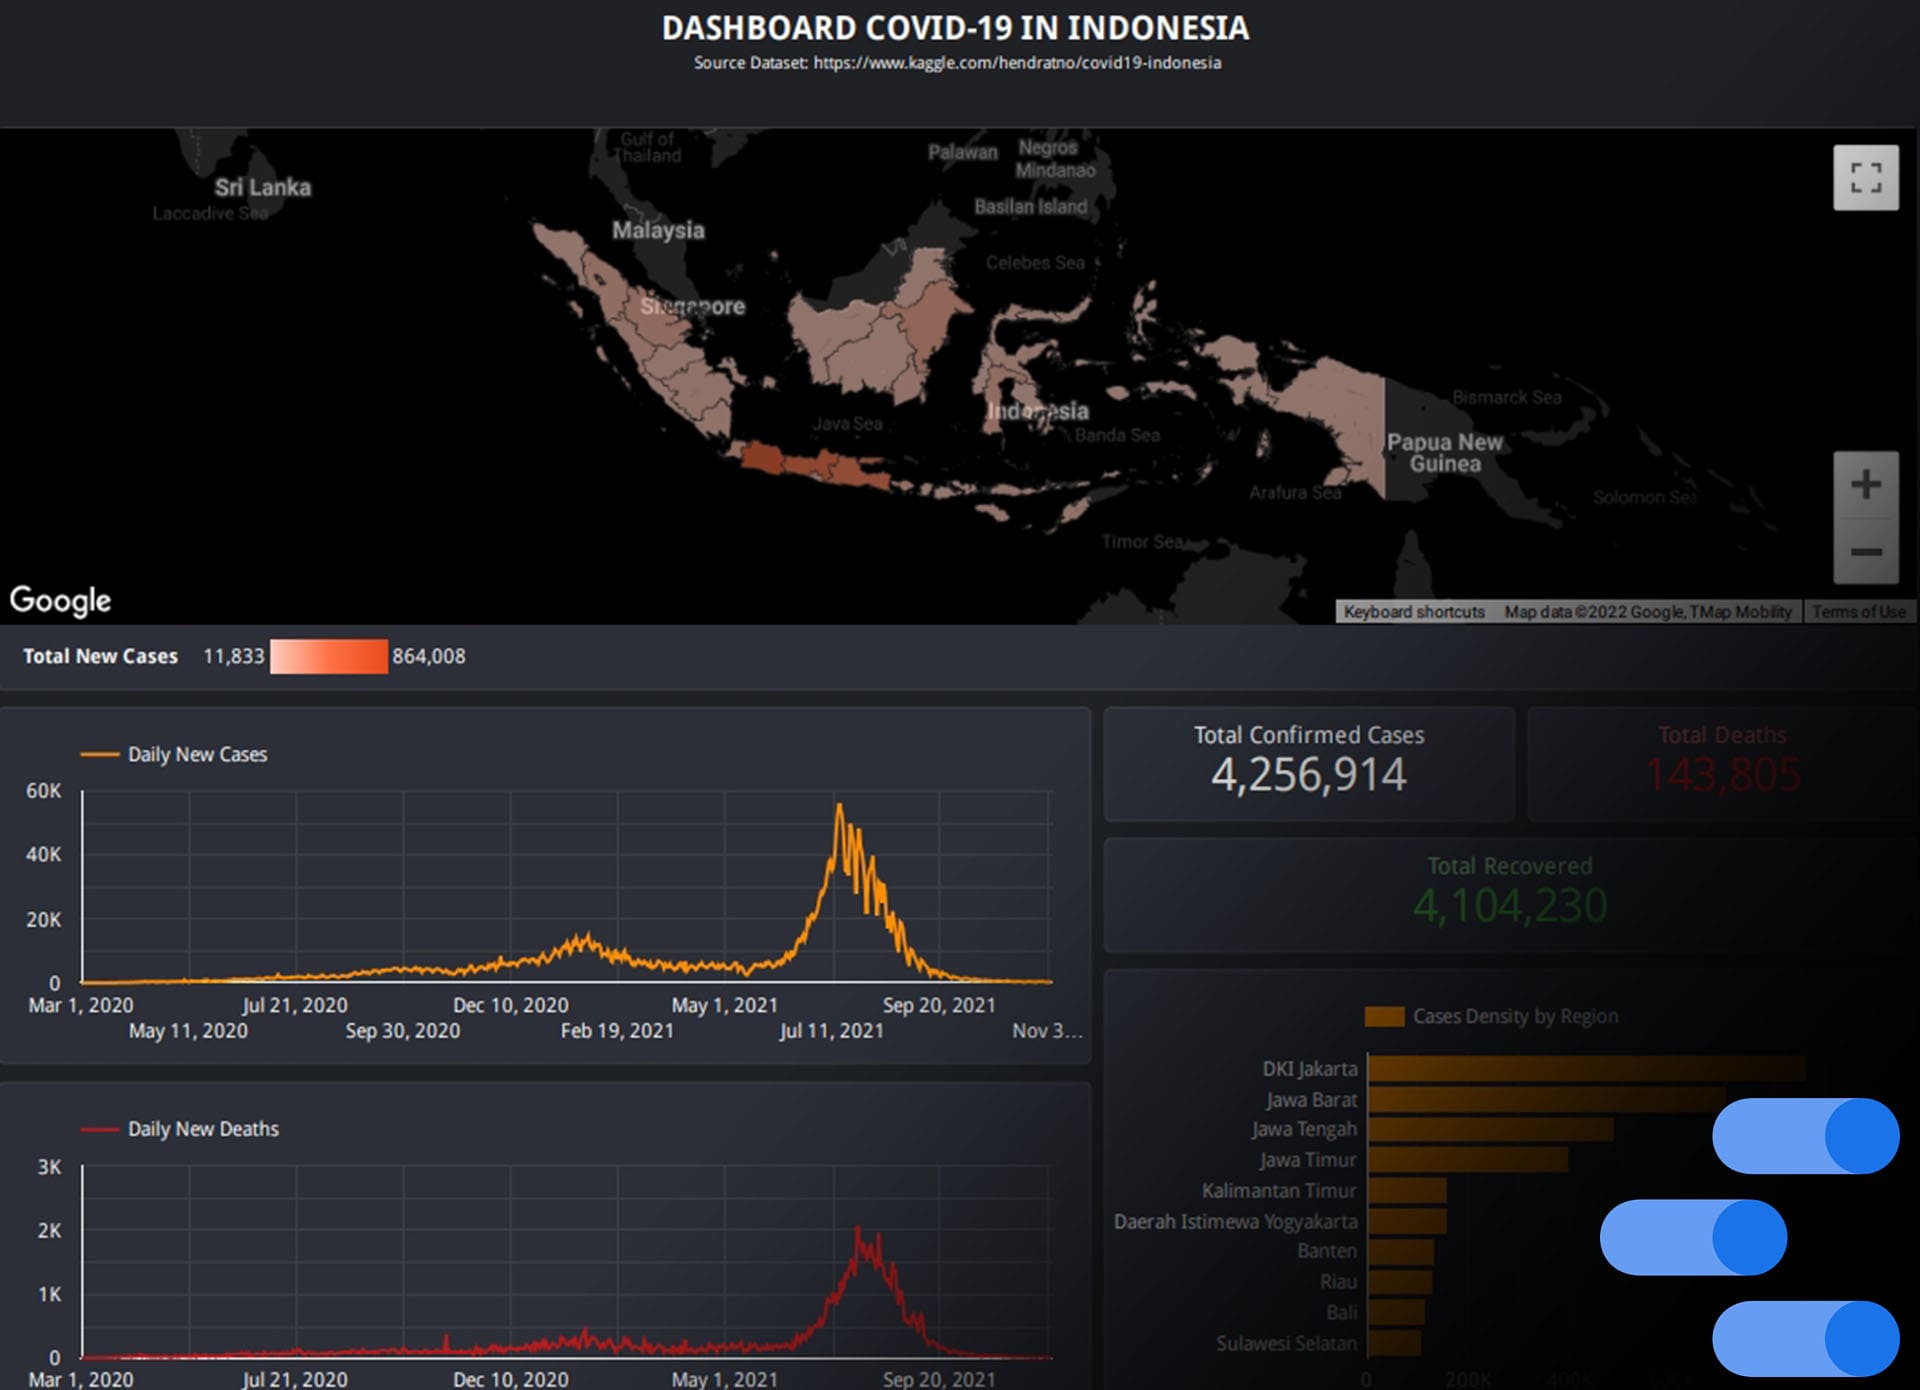
Project Google Data Studio (Dashboard Covid-19 in Indonesia)
This is a Covid-19 dashboard display that I have created using an open dataset from kaggle that contains data on the development of covid in Indonesia until early 2022, showing the total density of cases with folders. Featuring also new cases per day and new cases of death per day, big numbers overall data, deaths and recovered and also total density affected by region
On the dashboard we found out that the most cases density is on the island of Java (DKI Jakarta, East Java, West, and Central). There is also a rise in cases on certain dates that is directly proportional to the number of deaths that rise as well which later we can find out why and what happened in that range of dates.
- Created - Jan 2022
- Technologies/Skills used - Data Collecting, Google Data Studio, Data Visualization
- Role - Data Analyst, Business Intelligence
- View Online - Click here

Project Python (Web Scraping Using BeautifulSoup, Pandas, and Requests)
This is a small learning project that I'm doing when I following the free "Data Analyst Bootcamp" playlist created by Alex The Analyst.
We are taught to do a Web Scraping process step by step by our amazing youtuber Alex, we are doing it using jupyter notebook (python), we are taught how to scraping a data from a real website, in this case we are using Wikipedia website that are showing a top company by revenue in USA, we are successfully doing that and also exporting our works into a CSV file. Please feel free to kindly check my work by clicking the link in the bottom of this page if you want to know how I'm doing it.
Even though it's free tutorial on youtube yet I have learned so many new things as an Data Science point of view, especially when using Python and their libraries and also a really nice 'resfresher' about python
Photo by Artturi Jalli on Unsplash
- Created - August 2023
- Technologies/Skills used - Jupyter Notebook, Python, Pandas, BeautifulSoup, Requests
- Role - Data Analyst, Business Intelligence, Business Analyst
- View Online - Click here
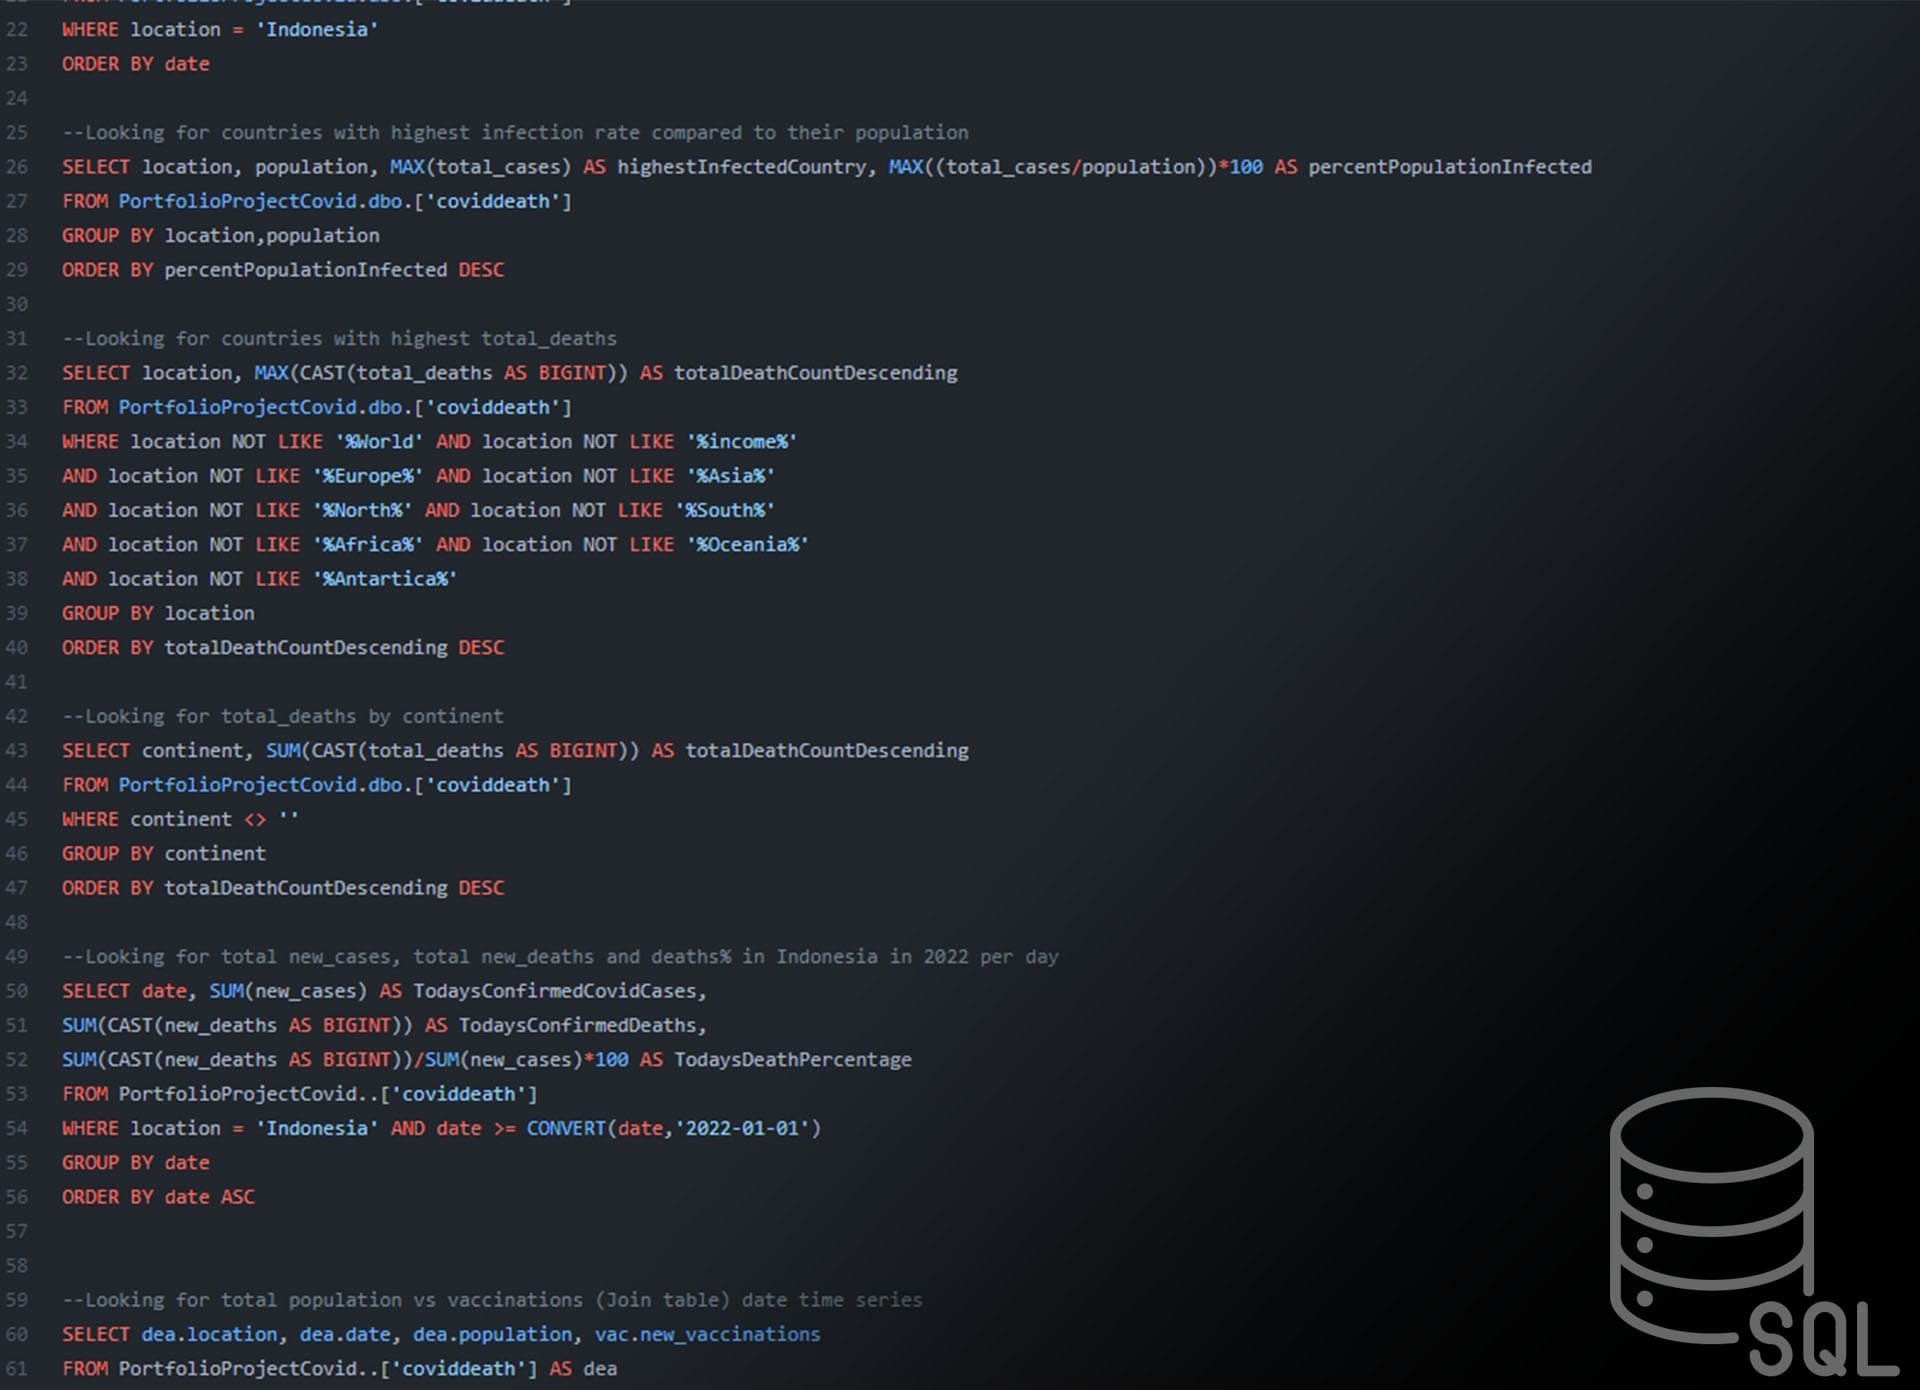
Project SQL (SQL Data Cleaning)
SQL (Structured Query Language) A query language designed for retrieving certain information from a database. In the image above is an example, we can also do data cleaning using SQL which later the data will be easier to use and analyze.
- Created - Jan 2022
- Technologies/Skills used - SQL, SQL Server, Databases, Query Writing
- Role - Data Analyst, Business Intelligence
- View Online - Click here